Shrinkflation — shrinking a product's size while holding the price steady, or raising it only slightly — has become one of the most-discussed pricing tactics in grocery shopping. A 2026 analysis of grocery pricing found the average family of four now pays roughly $741 more a year for the same groceries compared to 2020, and a portion of that increase comes specifically from package downsizing rather than sticker-price changes alone. Below is how the math actually works, and a calculator to check any product yourself.
Why the sticker price alone doesn't tell the real story
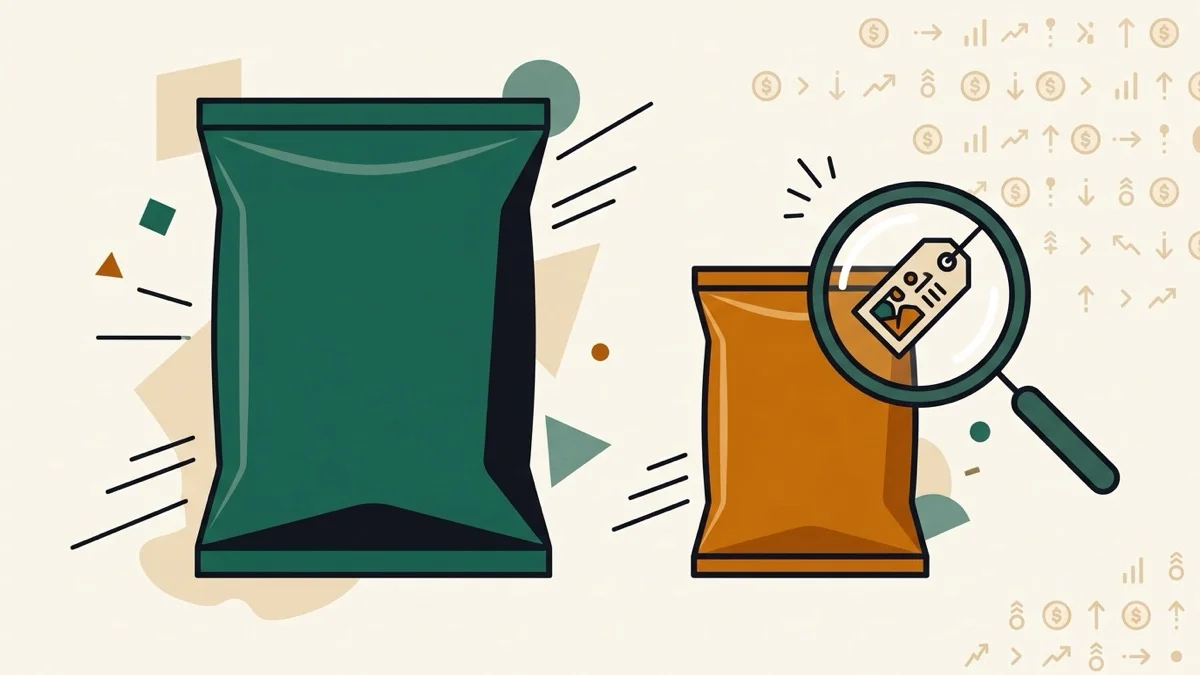
A company can leave a product's price completely unchanged and still raise what you're effectively paying, simply by putting less product in the same package. The number that actually matters is price per unit — price divided by size — compared before and after. A well-documented example: a bag of a popular chip brand cost $4.79 for 15.5oz in 2021; by 2026, the same shelf spot held a $6.69 bag at 14.4oz. The sticker price rose about 40%, but the real price per ounce rose closer to 50% — the shrinking package quietly did some of the work a straight price hike would have had to do on its own.
How much shrinkflation actually costs you
Capgemini consumer research found 61–71% of shoppers across major markets have noticed shrinkflation, and in the US specifically, 56% of shoppers in 2025 reported multiple everyday grocery items getting smaller without a matching price drop. On its own, one shrunk bag of chips is a small amount — but multiplied across a household's regular grocery list and repeated purchases over a year, the figures compound into the hundreds of dollars cited in the 2026 analysis above.
Calculate it for a product you've noticed
Our shrinkflation calculator takes the old and new size and price from any product and shows the real per-unit price increase — plus, if you enter how many you buy a month, what that product alone is costing you extra over a year. No account, no data collection — everything runs in your browser from the numbers you enter.
Sources: grocery cost increase and per-family figures via WFSB; consumer awareness statistics via Capgemini research as reported by DontPayFull; chip pricing example via consumer pricing trackers cited in the same report.